
EV Market – 1.2% of all Sales
Glass half full or half empty? Convex or concave? How you see things often depends on your perspective.
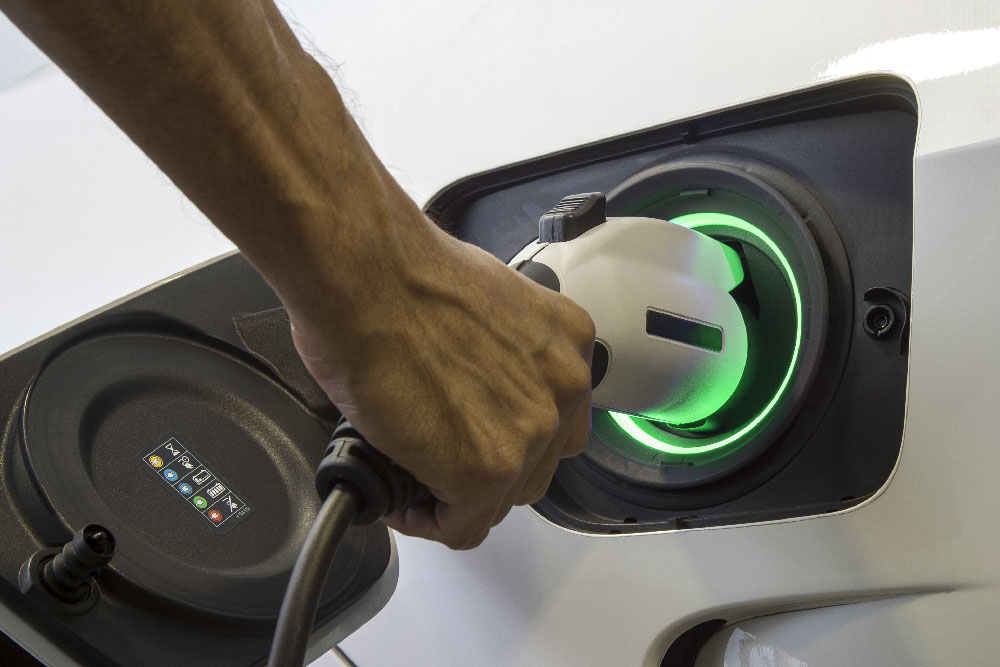
The electrification of the U.S. light-duty vehicle fleet is a perfect example. People tend to see what they want to see or what their biases condition them to see.
Recently released 2019 vehicle sales figures are likely to continue that pattern. The 244,271 battery-powered electric vehicles (EVs) sold in 2019 continued a five-year period of consistent EV sales growth. Here’s a summary of both raw sales numbers and EVs as a percentage of total light-duty vehicle sales since 2015:
EV Sales
- 2015: 72,374 (0.41%)
- 2016: 80,039 (0.46%)
- 2017: 99,142 (0.58%)
- 2018: 208,573 (1.20%)
- 2019: 244,271 (1.43%)
By any measure, more than tripling EV sales in five years is an impressive accomplishment. However, EVs’ 1.43% market share in 2019 remains a small part of the total sales picture.
For comparison purposes, liquid fuel vehicles (gasoline, diesel, and hybrids) retained their dominant position in 2019 with 98% of the market, down only 1.3% since 2015.
Liquid Fuel Vehicle Sales
- 2015: 17,357,844 (99.3%)
- 2016: 17,399,102 (99.1%)
- 2017: 17,033,429 (98.8%)
- 2018: 16,974,059 (98.1%)
- 2019: 16,738,081 (98.0%)
Anecdotal evidence also suggests that EVs have a long way to go to challenge liquid-fuel vehicles in the market. Here are two recent examples:
Last September, RS Automotives, a Takoma Park, Maryland gas station used a $786,000 public/private grant to switch out all of its gasoline dispensers for EV charging stations. At the time, Maryland had about 21,000 EV registrations. Four months later, how’s business at the all-electric station? Well, the owner says he is charging an average of four to five vehicles a day. Can you imagine any of your fuel marketer customers trying to build a business on those numbers?
Just as interesting was a recent experiment by Motor Trend to compare the fuel cost of electric and gasoline-powered Hyundai Kona sedans on a 450-mile round-trip between Los Angeles and Paso Robles, California. To juice up the Kona Electric, Motor Trend used public Electrify America stations that charged a $1 session fee plus $0.69 per minute of charge.
Total charging costs for the Kona Electric were $140.97. Total fuel costs for the gas-powered Kona were $63.03. Although the researchers cautioned that the EV probably would score better on long-term total cost of ownership, even they were surprised at the comparative fuel costs.
The future of EVs? What do you see?
This article originally appeared in the February 4, 2020 issue of the Petroleum Equipment Institute’s “Tulsa Letter” newsletter.


